

Modulated Transfer Function (MTF) charts can be useful references when researching, comparing, and purchasing a lens. MTF chart is a measurement of the optical performance potential of a lens and can give you a better understanding of the optical quality of various lenses. Using an MTF chart is the preferred method for studying lens optical performance as they use theoretical equations to plot a performance graph and don’t rely on subjective opinion, subject matter, camera features, software, or other factors.
They can be obtained from the websites of well-known lens manufacturers like Canon and Nikon for their produced lenses. Other sources where you can find MTF charts for lenses are optic testing websites like lenstips and DXOMark. The latest site also provides an evaluation score of the lens-camera combination test results.
Basic definitions
-
Sharpness
It is comprised of two parts: Resolution and Acutance. They are equally important and thus affect the overall perceived sharpness.
-
Acutance
It is the quality of transition between edges in an image frame. If it is not sharp and sudden, it’ll make the image appear a little soft.
-
Resolution
It stands for the amount of fine detail that a lens is capable of transmitting.
-
Contrast
It stands for the ability of a lens to distinguish between different light intensities (e.g. blacks and whites).
-
Chromatic aberration
It is also known as “color fringing” or “purple fringing”, it is a common optical problem that occurs when a lens is either unable to bring all wavelengths of color to the same focal plane and/or when wavelengths of color are focused at different positions in the focal plane.
-
Astigmatism
A defect in the lens is caused by a deviation from spherical curvature, which results in distorted images, as light rays are prevented from meeting at a common focus.
-
Field Curvature
It is a common optical problem that causes a flat object to appear sharp only in a certain part(s) of the frame, instead of being uniformly sharp across the frame.
What is MODULATION TRANSFER FUNCTION (MTF)?
Lens manufacturers came up with objective methods to measure lens performance in controlled lab environments. Since no lens is perfect in transmitting light, MTF can be quite useful in quantifying the loss of both contrast and resolution. Acutance does not apply here because we are not talking about our perceived sharpness.
One of the advantages of MTF is that it is capable of providing plenty of useful information in a single chart like the following:
- Lens Resolution (center to extreme corners at maximum and stopped down apertures)
- Lens Contrast (center to extreme corners at maximum and stopped down apertures)
- Astigmatism and Lateral Chromatic Aberration
- Field Curvature
- Focus Shift
How MTF is measured
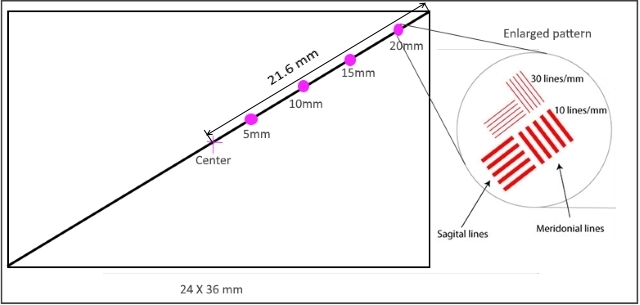
By photographing a standard test target with a dimension of the full frame and pattern that containing lines that are 100% black with 100% white spaces of varying widths between them. The pattern of repeating lines sets are drawn sagittally (parallel to the diagonal of the image format) and meridionally (at right angles to the sagittal lines) through the exact center of the area that is photographed, The MTF is usually measured for a fixed line frequency (usually 10 lines per mm and 30 lines per mm). As shown in the following figure:
How to read an MTF chart
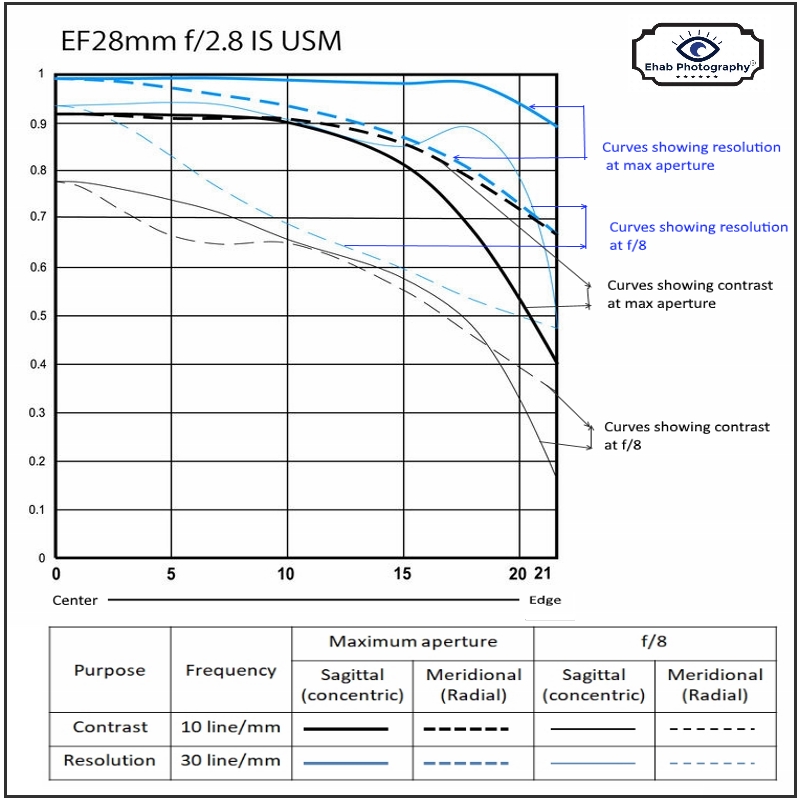
MTF graphs are plotted on two axes: the horizontal (X) axis represents the distance in millimeters from the center (‘0′ point) of the image, while the vertical axis represents contrast and has a maximum value of 100% or 1. The length of the X-axis depends on the image format, with the 35mm format axis measuring approximately 21.5mm (half the diagonal of the frame), the APS-C format measuring roughly 14mm, and the Four-Thirds format at 11.25mm.
The MTF data for each lens is normally provided for two spatial frequencies: 10 lines/millimeter and 30 lines/millimeter, which are shown in different colors. For each spatial frequency, the MTF is usually plotted for two lens apertures, the maximum aperture, and stopped down to f/8. The solid lines on the plot indicate the performance of the lens for the sagittal lines (parallel to the diagonal of the frame), while the dashed lines relate to the meridional lines (perpendicular to the sagittal lines).
A sample chart is shown below that is provided by the lens manufacturer with a key of the 8 drawn curves.
MTF chart – Assessment guidelines
- A completely hypothetical “perfect” lens, which doesn’t exist in real life, would render MTF results with all its lines running as a completely horizontally straight line across the very top of the chart from the left to the right edge.
- In general, the higher a curve appears, the better the optical performance it’s describing, either in regards to contrast or resolution.
- If the MTF graph for a lens shows the 10-line/mm curve to be greater than 0.6 it’s considered a satisfactory performer. Lenses for which the 10-line/mm curve is greater than 0.8 deliver excellent image quality.
- As you follow the lines from the left of the graph to the right, you track the distance from the center of the image. In most graphs the lines will trend downwards as they approach the right-hand side; a steep drop on the right side of the graph indicates edge softening.
- The MTF curves at a wide aperture (black) are most relevant when you are using your lens in low light, need to freeze rapid movement or need a shallow depth of field.
- The MTF curves at f/8 are most relevant for landscape photography, or other situations where you need to maximize depth of field and sharpness. They are also more useful for comparisons because blue lines are always to be at the same aperture: f/8.0.
- The closer the Sagittal and Meridional lines (solid and dashed lines) at a given aperture are to each other, the more natural the lens’ background blur will usually appear.
- A significant difference in MTF for the sagittal and tangential directions indicates an aberration such as astigmatism (where circular areas in the subject become increasingly oval in shape towards the periphery of the frame).
- When the MTF in S is greater than in M, objects are blurred primarily along lines radiating out from the center of the image. Similarly, objects are blurred in the opposite (circular) direction when the MTF in M is greater than in S.
- You cannot make meaningful comparisons between lenses of different focal length categories strictly based on MTF results. For technical reasons, the MTF results you’ll see from wide-angle and especially ultra-wide lenses will show far more diminished MTF results toward the outer edges than you’ll see with telephoto lenses.
- Different manufacturers generate MTF through different methods which make comparing MTF data between companies difficult to interpret. Additionally, not all lens companies release MTF data which can make finding the charts difficult.
- Although the MTF chart provides data about the sharpness and contrast of a lens, it ignores other very important factors when comparing lenses such as vignetting, distortion, and lens flare.
FINDING THE “SWEET SPOT” OF A LENS
The website Lenstips offers another type of MTF chart. The figure below shows the MTF-50 for various apertures for Canon EF 85 mm f/1.8 USM.
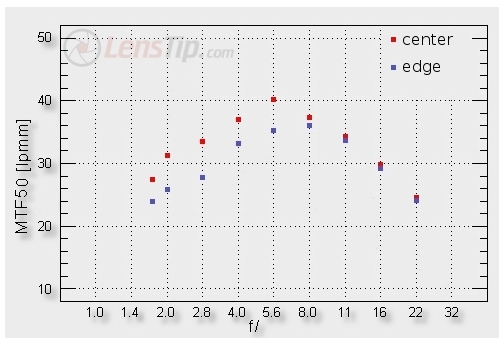
The aperture corresponding to the maximum MTF is the so-called “sweet spot” of a lens since images will generally have the best sharpness and contrast at this setting. From the above chart it is clear that the sweet spot is at f/5.6 in the center and f/8 at edge.
On a full frame or cropped sensor camera, this sweet spot is usually somewhere between f/8.0 and f/16, depending on the lens. The location of this sweet spot is also independent of the number of megapixels in your camera.
Conclusion
MTF charts offer a clear way to give users a good idea of the relative optical quality of one or more lenses. While slightly complex and non-intuitive at first, if you understand a few basics about them, it becomes a lot easier to digest an MTF chart’s information and apply it to your present and future lenses.
While the contrast and resolution readings on MTF charts give a good idea of important aspects of a lens’ likely image quality, they obviously cannot give a user all he or she needs to know about how well-suited a lens is to them. Regardless of MTF results, users have to consider other factors when thinking about a lens purchase: how important a particular focal length lens will be in their mind, a lens’ size/weight/portability, how well-balanced a lens’ handling is, how easily or readily it manually focuses, how close a lens focuses, whether a zoom lens’ range would be ideal or limit in some way, whether its maximum aperture is well-suited to the type of work he or she anticipates using it in, whether or not it offers features with real-life benefits like Image Stabilization and, of course, price.
Thanks for reading the article, hope you found what you are looking for. If you have any questions or need more information about the subject, please drop your query in the box below, I’ll be glad to reply. If you like the site, don’t forget to subscribe, we will inform you only if a new article is posted.


Wow! This is another superlative and informative camera lecture by Hashem. The most important component in camera is Lens. Knowing the resolution and acutance in lens is really important when getting a camera.Getting to understand how to makes use of the lens and it setting is important for me. I’ll keep going through this article till i perfected it usesThank you for this wonderful post