

The major breakthrough that digital photography made is its ability to display instantly the image on the back of our cameras, so you can review and evaluate the exposure of your image. Furthermore, you can fine-tune your exposure by using the histogram; a magnificent tool offered by digital cameras. You can use it to determine whether your image is too bright or too dark. In this article, I’m going to explain how to read a histogram and use it to your advantage to Getting the best exposure which should be your goal every time you click the shutter.
What is a histogram?
The histogram is a graphic representation of the brightness of your image that will help you determine if your photo (or part of your photo) is correctly exposed, underexposed (too dark), or overexposed (too light).
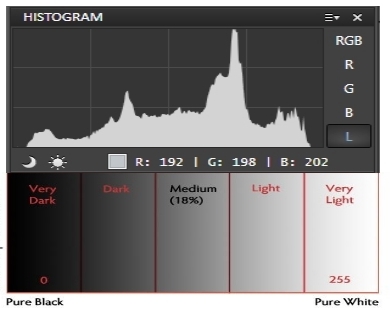
The graphic information in a histogram is displayed as ridges that spread from right to left, starting from black and going through the mid-tones and then to white. Each peak indicates the number of pixels for a particular level of luminosity: the higher the peak, the greater the number of pixels for that brightness level. Most modern digital cameras have four histograms. The primary one is the luminosity histogram which shows the overall brightness of a scene. This histogram usually has a monochromatic display—either white data on a black chart or vice versa. The other three histograms are the color histograms, representing the red, green, and blue-sensitive pixels on the sensor. These histograms are generally displayed in their respective colors. The luminosity channel is shown in the photo below:
The colored channels are shown in the following photo.
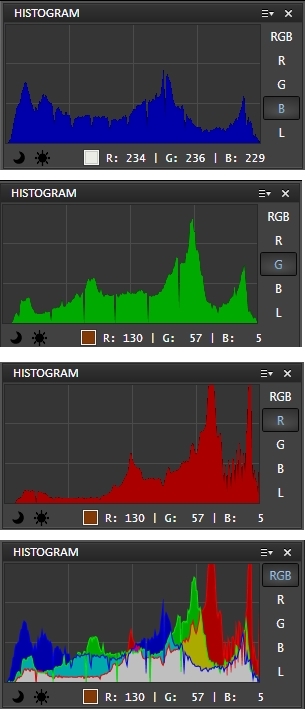
Luminance histograms are more accurate than RGB histograms at describing the perceived brightness distribution or “luminosity” within an image. Luminosity takes into account the fact that the human eye is more sensitive to green light than red or blue light.
Is there a perfect histogram?
There are a lot of discussions on what the “perfect histogram” should look like. The claim is to have a distribution across all light levels in the image, as well as to have slightly increased exposure, and it shouldn’t extend to either far ends of the histogram. As the figure below
I can’t say I totally agree with this thinking because it also depends on what is the condition of the actual scene lighting.
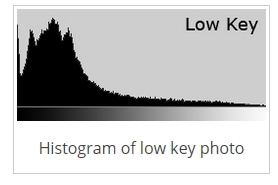
The following is a histogram for a dark subject, it is not wrong it is just more shifted to the left to represent the tones of the subject. This might be a black subject or a dark background. This situation also happens in low key photography as shown in the figure below.
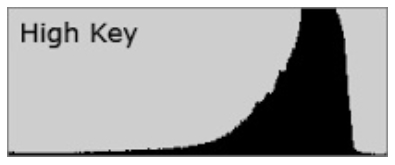
The following is a histogram for a light subject with mostly light tones in the scene and few dark areas. See how it is shifted to the right now versus the dark subject. It is also the situation of high key photography.
An image can be considered as corrected exposed when the tonal range is well distributed in the histogram, without clipping. A histogram is a good tool for knowing whether clipping has occurred since you can readily see when the highlights are pushed to the edge of the chart. Some clipping is usually ok in regions such as specular reflections on water or metal, when the sun is included in the frame or when other bright sources of light are present. Ultimately, the amount of clipping present is up to the photographer and what they wish to convey.

When you have to adjust your exposure
Gaps on either end indicate you are missing information and your exposure can be shifted safely without losing detail. If your histogram is shifted too far in one direction or the other so that it does not even touch the other edge as the figure below.
You’ll lose details where your image is too bright or too dark. An underexposed image is too dark, with the histogram shifted to the left, and an overexposed image is too light, with the histogram shifted to the right.
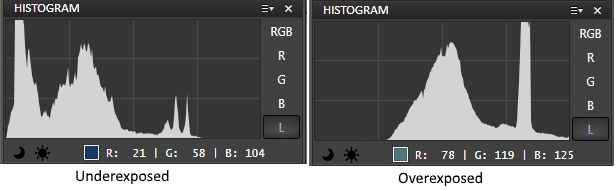
If a photo is overexposed or underexposed as shown in the histogram as missing pixel information on the far left or far right. This is when you should adjust your settings to compensate – try a different shutter speed, choose a larger or smaller aperture, increase or decrease the ISO, or adjust the exposure compensation.
CONTRAST
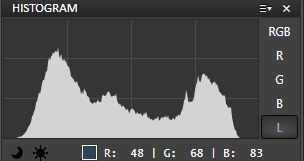
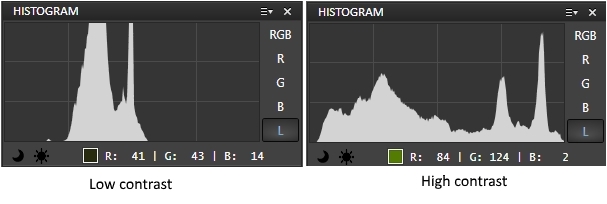
A histogram can also describe the amount of contrast. Contrast is a measure of the difference in brightness between light and dark areas in a scene. Broad histograms reflect a scene with significant contrast, whereas narrow histograms reflect less contrast and may appear flat or dull. The difference, in contrast, is shown in the following figure.
Remember to use the highlight warning
To help you establish how far to go in the image brightening direction, most SLR cameras have a setting called “highlight warning”. It will make any overexposed highlights “flash” or blink when you preview your images on your camera screen. Canon users press the “Display” or “Info” button (depends on your model) until they show up on the screen when previewing images. You also may need to turn on this feature in the menu settings. Check your camera’s manual if you aren’t sure where to find it. Your camera will display the following image:

Finally, reading a histogram correctly will give you the tools you need to create a dynamic range of tones, with rich darks and bright whites, without losing detail on either side.
Thanks for dropping by, hope you enjoy reading the article and found it useful. If you have any comments, please write it down in the box below.
If you like the site, Don’t forget to subscribe, you will be informed when a new article is posted.


I remember taking a distance basic photography class many years ago. Every time I would submit a photo, the instructor would talk about the histogram first. I think that was very important, because exposure might have appeared to be fine on the camera, but when I looked at it on a computer, it was almost always too bright or too dark.
Learning how to use the histogram has enabled me to consistently take photos with balanced exposure, and has cut way down on post processing. The histogram is certainly a very useful tool.
Thanks, Paul.